 Skip to content


Services / Icing and aircraft systems
Engineering analysis and simulation of ice accretion, testing and certification
ATS is an engineering company: we plan and run the icing analyses and tests for your aircraft, and issue the certification documents, ready for you to review and submit to the authorities. We use validated simulation to find where supercooled droplets impinge, what ice forms and how it affects flight.
Led by Dr. Guilherme A. Lima da Silva: ten years at Embraer (1997 to 2007) designing and certifying anti-ice for wings and air data probes, with tests in the NASA icing tunnel, then icing projects for industry at ATS, including ice-accretion substantiation and certification-support analyses for Akaer's STC with Turkish Aerospace. He designed the first icing tunnel in Brazil (UFRJ) and is the ATS liaison to the SAE AC-9C committee.
No ice. Kinetic heating (recovery temperature) keeps the whole leading edge above 0 °C, even though the air is below zero.
Rime ice. Freezing fraction ≥ 1: water freezes on impact and the ice follows the collection distribution.
Mixed ice. Part of the water runs back before it freezes and horns start to form (incipient horns, still with little aerodynamic penalty).
Glaze ice. Most of the water runs back and freezes into horns. Upper horn height and angle are the parameters that most affect lift, stall and drag. Ice always starts as rime on the cold surface; horns appear once latent heat has warmed it.
Main assumptions
- Integral boundary layer with abrupt transition by the Makkonen (1985) criterion, LEWICE 3.2 roughness and rough-wall Stanton number; full first law in each control volume, with water conserved and running back until it freezes; one growth step.
- 1 m NACA 0012 at 4° angle of attack, 10,000 ft, 20 µm MVD (Wright distribution), 2D flow, ice at 917 kg/m³.
- FAR 25 Appendix C LWC as tabulated by Jeck (2002), corrected for the distance flown in cloud.
Simplified illustrative model, not a simulation or test result. Against NASA IRT icing tunnel data (Shin and Bond), the mean shape error is 0.36 % of chord with one step (0.33 % with two), close to LEWINT 1.04 (LEWICE 3.22) at 0.31 %. References: Shin & Bond, NASA TM-105374, 1992 (IRT test); Silva, Barros, Pio, Rafael, Stefanini & Pimenta, Handbook of In-Flight Icing, Springer, 2023; Stefanini, MSc dissertation Poli-USP, 2009; Smith & Spalding, J. R. Aeronaut. Soc., 1958; Ruff & Berkowitz, LEWICE, NASA CR-185129, 1990; Jeck, DOT/FAA/AR-00/30, 2002 (FAR 25 App. C); Neves et al., J. Aircraft, 2026.
Want to run the model or check the validation? The Python code for the model and for the NASA test comparison is sent by e-mail.
Request the codeParameters and solved variables
Fixed parameters
- Chord / leading-edge radius
- 1 m / 1.58 % c
- Angle of attack
- 4°
- Droplets
- MVD 20 µm, Wright distribution (LEWICE)
- Pressure altitude
- 10,000 ft (69.7 kPa)
- Transition
- abrupt, Rek ≥ 600·exp(−0.9λ) (Makkonen)
- Roughness
- ks = ½(0.15 + 0.3/Nf,stag) mm (LEWICE)
- Ice density
- 917 kg/m³
Solved variables
- Distance flown in cloud
- —
- Extent factor F (Jeck)
- —
- Envelope LWC × F
- —
- Total temperature (stagnation recovery)
- —
- Stagnation h (Smith and Spalding)
- —
- Water catch at stagnation
- —
- Stagnation freezing fraction
- —
- Equivalent roughness ks
- —
- Transition onset, upper / lower surface
- —
- Stagnation thickness
- —
- Upper horn (height, position)
- —
How it is calculated
1D model of the kind used in the classic codes (LEWICE, ONERA, TRAJICE). Panel-method potential flow on a 1 m NACA 0012 at 4°; collection efficiency β from droplet trajectories with 20 µm MVD and the Wright distribution used in LEWICE (precomputed for 100 to 250 KTAS). Integral boundary layer from stagnation: laminar h after Smith and Spalding (1958), with ue = C·s at stagnation; Pohlhausen laminar profile; abrupt transition when the roughness Reynolds number, with the velocity at height ks, exceeds 600·exp(−0.9λ), with λ = δ₁²(due/ds)/ν (Makkonen, 1985, pressure-gradient correction); rough turbulent after Kays and Crawford, with the momentum thickness starting from the laminar value at transition and roughness Stanton number C = 1.92 (LEWICE). LEWICE 3.2 equivalent roughness, ks = ½(0.15 + 0.3/Nf,stag) mm, iterated with the stagnation freezing fraction. First law in each control volume, marching the water from stagnation: convection with the recovery temperature, evaporation with the boundary-layer edge pressure and temperature, droplet sensible heat and kinetic energy, runback sensible heat (carrying each volume's temperature to the next), conduction into the ice, latent heat; the surface temperature is solved in rime (below 0 °C) and on wet surfaces (above 0 °C). Water is conserved volume by volume: it only stops when it freezes; the film on the ice follows the air shear, the pressure gradient and the droplet momentum. One growth step, without recomputing the flow over the ice. FAR 25 Appendix C LWC for 20 µm MVD as tabulated by Jeck (DOT/FAA/AR-00/30, 2002): Table 2 for the continuous maximum (17.4 nmi) and Table 1 for the intermittent maximum (2.6 nmi), linear in temperature; in the continuous maximum LWC is multiplied by the extent factor F from Table 2 (1.34 at 5 nmi to 0.215 at 300 nmi, interpolated on the log of distance); in the intermittent maximum the exposure is the time to cross 2.6 nmi. Ice density 917 kg/m³, as in LEWICE. For design ice shapes we use CFD++, LEWICE or iceAccretionFoam and icing tunnel tests.
Comparison with test data (NASA IRT) and with LEWINT

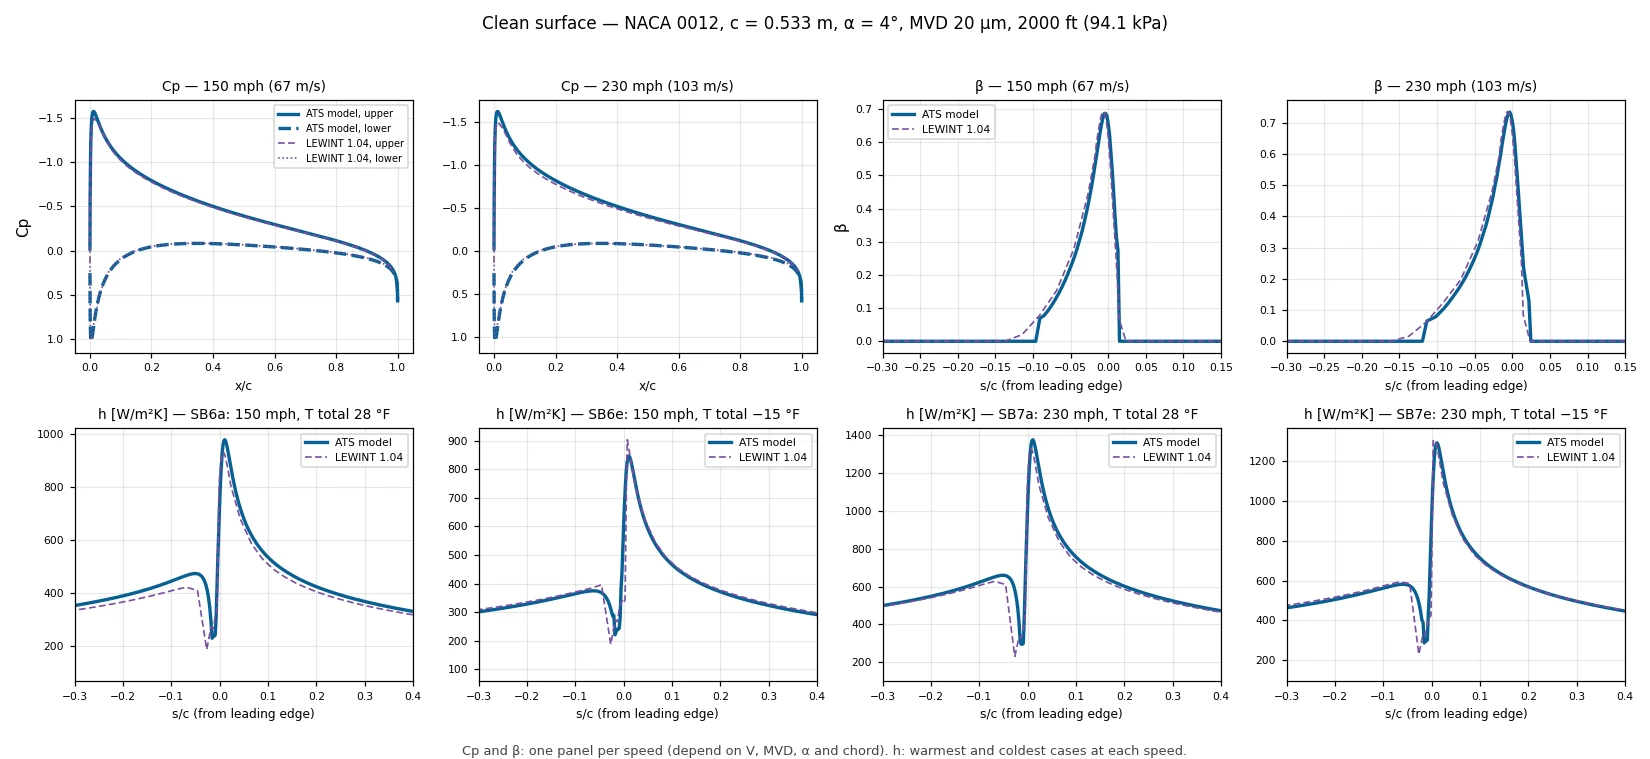
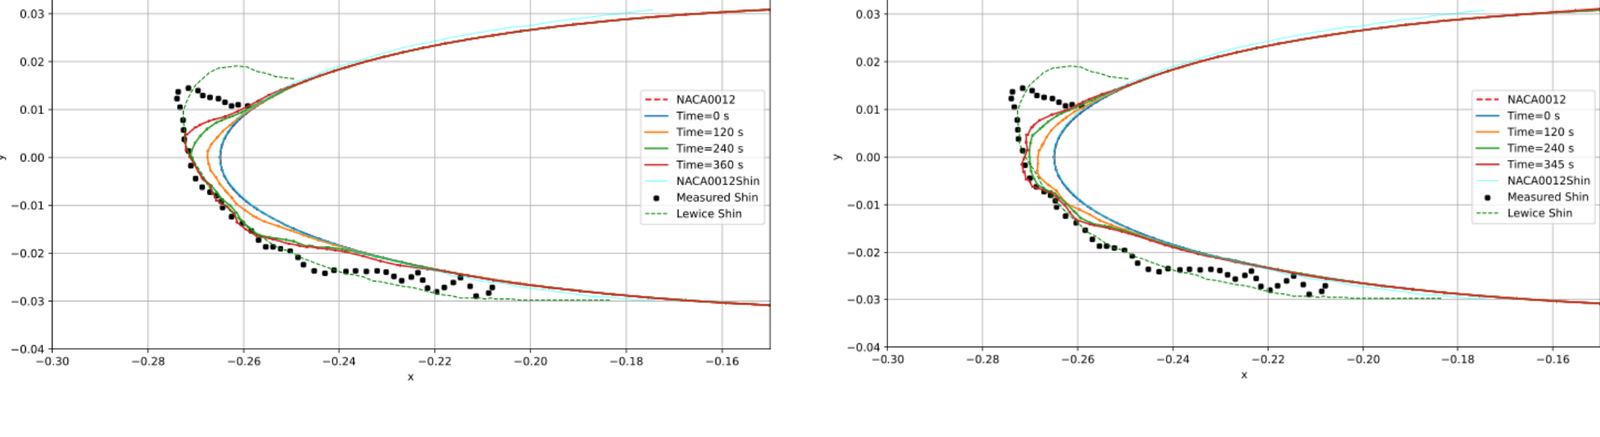
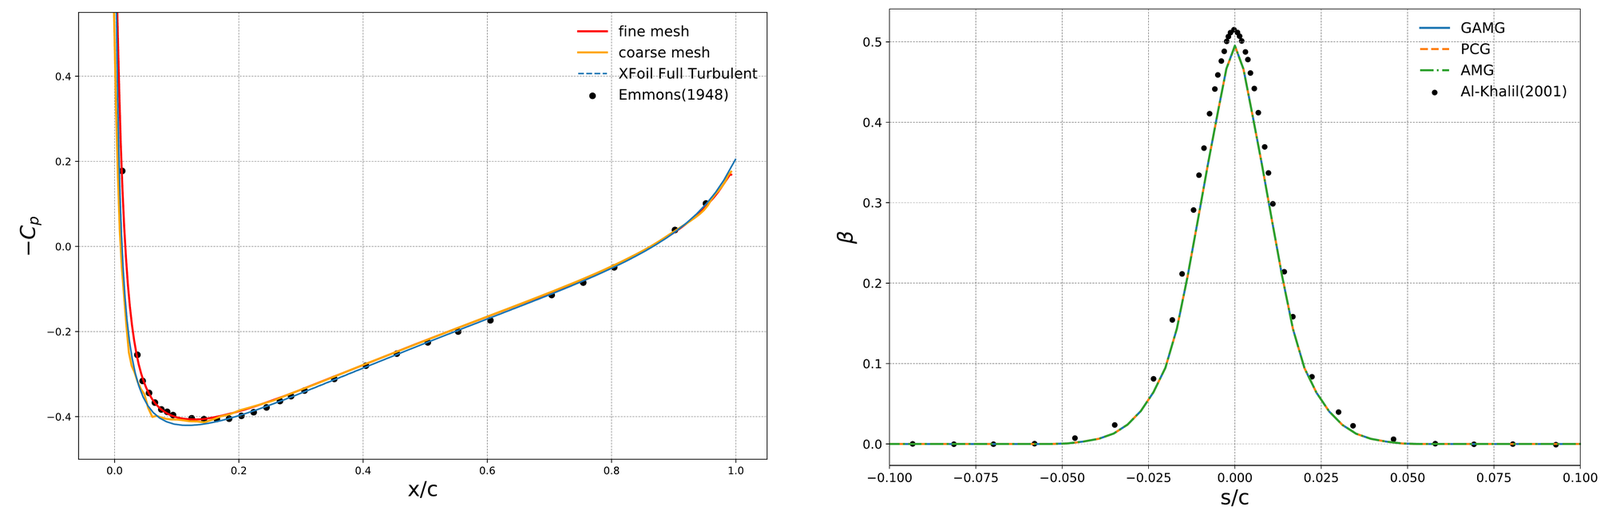
ATS model with the same equations as the applet and two growth steps (the second recomputes flow, trajectories, boundary layer and balance over the iced shape), at the Shin and Bond conditions (NASA TM-105374, 1992): 0.533 m NACA 0012, α = 4°, MVD 20 µm, 2000 ft (IRT test section), 150 mph with LWC 1.0 g/m³ for 6 min and 230 mph with 0.55 g/m³ for 7 min, total temperature from 28 °F to −15 °F. Red: outer contour of the repeat test runs, digitized from Figures 6 and 7 of the report; dashed purple: LEWINT 1.04 (LEWICE 3.22, ATS licence) at the same conditions, with automatic time steps. Mean shape error (mean distance between the curves over the iced region): ATS model 0.33 % of chord, LEWINT 0.31 %; with one step, as in the applet, 0.36 %. The second figure compares Cp, β and h on the clean surface with LEWINT: Cp and β one panel per speed, since they depend on airspeed, MVD, angle of attack and chord; h for the warmest and coldest cases at each speed. Both codes err more near 0 °C, where the freezing fraction depends strongly on h and the scatter between repeat test runs is also larger.
Icing track record
- ProjectAkaer, ASOJ TA, 2020 to 2024: Turkish Aerospace STC, ice-accretion substantiation and certification-support analysesATS performed the analyses, with simulation, in partnership with Akaer. Icing on new antennas, radomes and STC devices, and engine ice ingestion.
- IndustryEmbraer, 1997 to 2007: anti-ice design and certification for the wing and for pitot, TAT, static port and smart probesSlat and wing thermal anti-ice with LEWICE and the NASA icing tunnel. Smart probes certified with CFD++, ahead of TSO-C16b. The foundation of ATS's icing engineering practice.
- ProjectIcing projects for Vertical (2025), Joby (2023–24), New Avionics (2017, drone ice detector), Collins Aerospace (2012), Droplet Measurement Technologies (LWC probe), Desaer (twin turboprop) and Zodiac Aerotechnic (ice detector)Client details and scope on request.
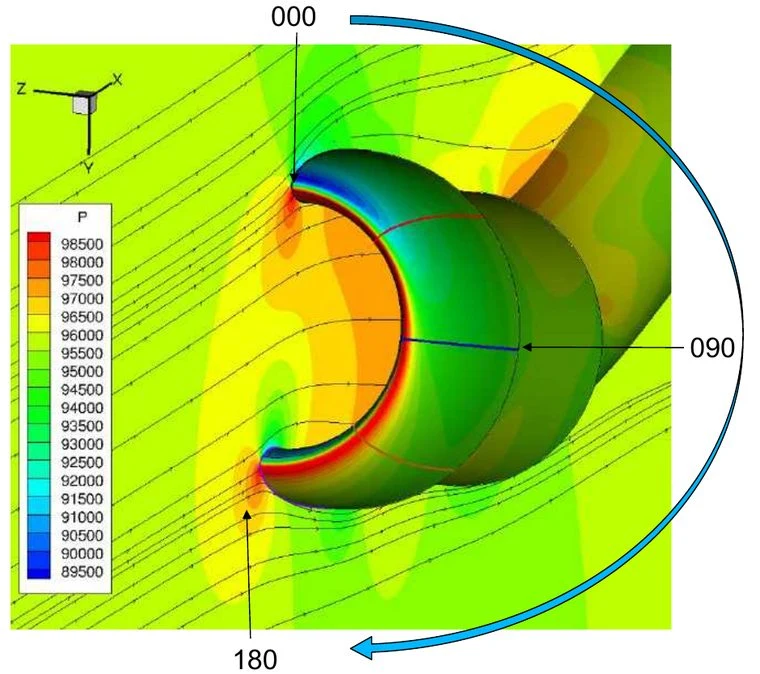
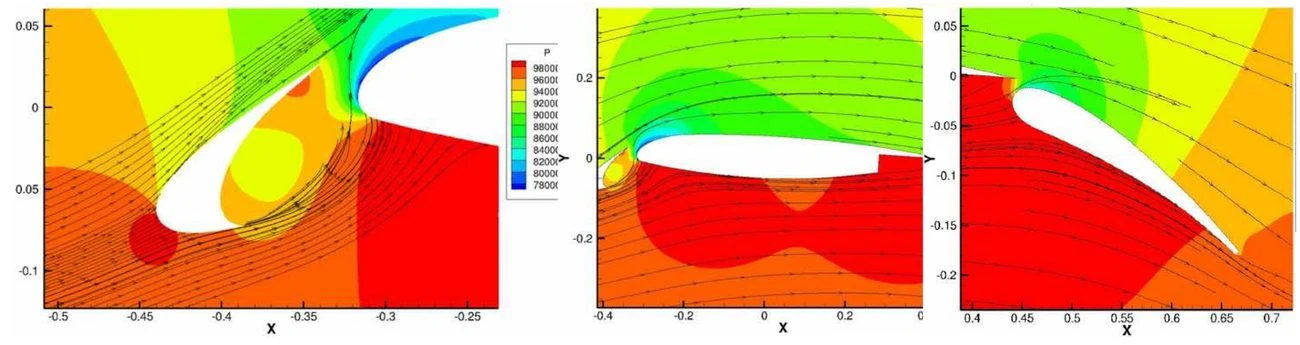
- ResearchThree impingement cases with CFD++ at the 1st AIAA Ice Prediction WorkshopTail, three-element airfoil and engine nacelle, with good results on supercooled large droplets.
- Certification and standardsPresented at SAE AC-9C in 2010, 2018, 2024 and 2025Portland, Colorado Springs, Ottawa and Capua. Dr. Lima da Silva is the ATS liaison to the committee.
- iceAccretionFoamOur 3D solver iceAccretionFoam: two Phil. Trans. R. Soc. A papers (2025) and FAPESP PIPE grant 2025/19697-9Developed with Prof. Hrvoje Jasak, University of Cambridge. This is product development, separate from the project experience above.
Flagship project: an STC for Turkish Aerospace
Akaer, ASOJ TA, 2020 to 2024. A long-term program: a Supplemental Type Certificate (STC) of Turkish Aerospace, with Akaer, for a surveillance aircraft modified with new surfaces. ATS performed the ice-accretion and ice-protection substantiation and certification-support analyses, with simulation, over the four years.
Project 2020 to 2024
What ATS was responsible for
Substantiation and certification-support analyses, with simulation, for a surveillance aircraft based on the Bombardier Global 6000. The STC and certification were held by Turkish Aerospace (TA), in Turkey, with Akaer; ATS's role was the icing engineering analyses. The program ran for four years.
Icing work
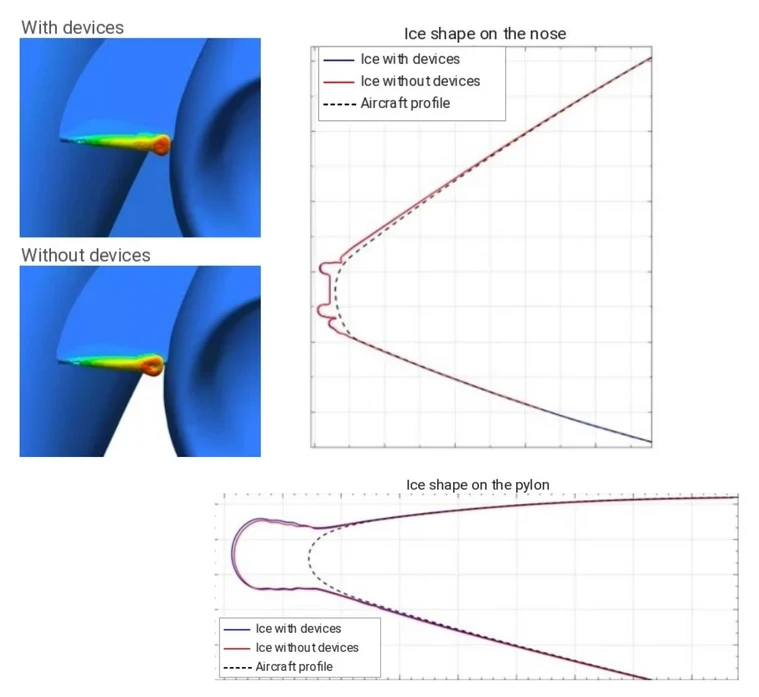
Ice accretion on the new air inlets, radomes, radar and additional STC devices. Ice shedding and ingestion by the engines. Comparison with the baseline aircraft for the additional ice. Ice protection system development and simulation with FENSAP-ICE, as the customer required.
Beyond icing
Redesign of the environmental control system for the surveillance variant under 14 CFR Part 25, a new liquid supplemental cooling system for the radar and other equipment, and laboratory, ground and flight tests. ATS's analyses fed into the certification reports.
Need only a part? We define the scope with you.
“Their work has been suitable for both development and certification.”
American Kestrel Company, on the organizations it lists for 3D icing analysis, ATS among them. Its founder, David Parkins, is an FAA Designated Engineering Representative for icing certification and a past chairman of the SAE AC-9C subcommittee. See the listing
What you receive
ATS issues the certification reports, whether they come from analysis results or from tests, and also the system description, the safety assessment, the certification plan or any other certification document. You review them and submit them to the authorities. This is our differentiator.
Collection efficiency and impingement limits
Where water hits, how much, and how far aft, for each droplet size (MVD) and liquid water content (LWC). Use it to size protected areas and to choose test points.
Rime and glaze ice shapes
2D and 3D shapes on unprotected surfaces across the FAR 25 Appendix C envelopes, with the critical points found for your aircraft.
Aerodynamic and system impact
Ice shapes handed to CFD to estimate lift, drag and handling penalties, with checks for engine ingestion, propellers and sensor blockage.
A report an authority can follow
Assumptions, mesh and convergence evidence, comparison with reference data, and traceability to the standards (SAE, MIL, ASTM) and to the test points.
Conditions come from your aircraft
FAR 25 Appendix C rests on NACA research from the 1940s and 1950s, and Appendix O adds large droplets, ice crystals, mixed conditions and freezing rain. We map both onto your flight envelope.
An icing matrix built from the mission
We analyze every flight phase, including holding, and the time spent in each one. Duration matters because ice keeps growing.
Critical points, not a generic grid
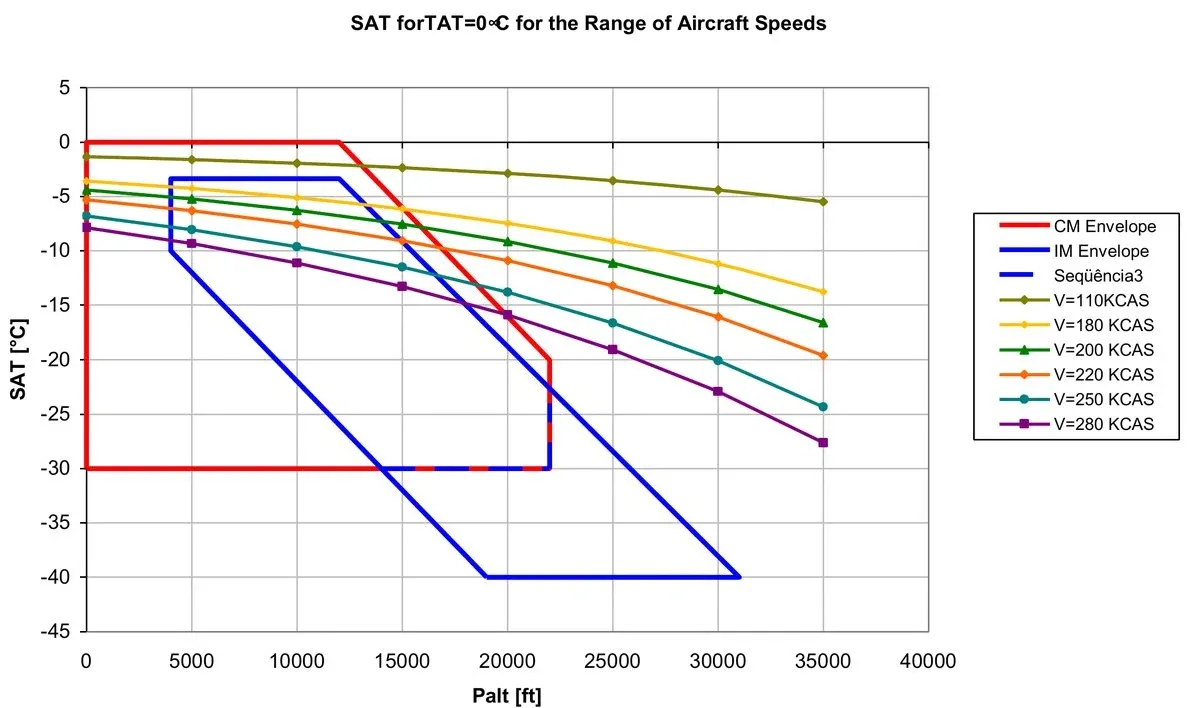
For each airspeed we find where the recovery temperature reaches 0 °C inside the envelope. That crossing gives the largest ice mass, in glaze. Light and heavy aircraft are both checked.
Impingement limits from flight dynamics
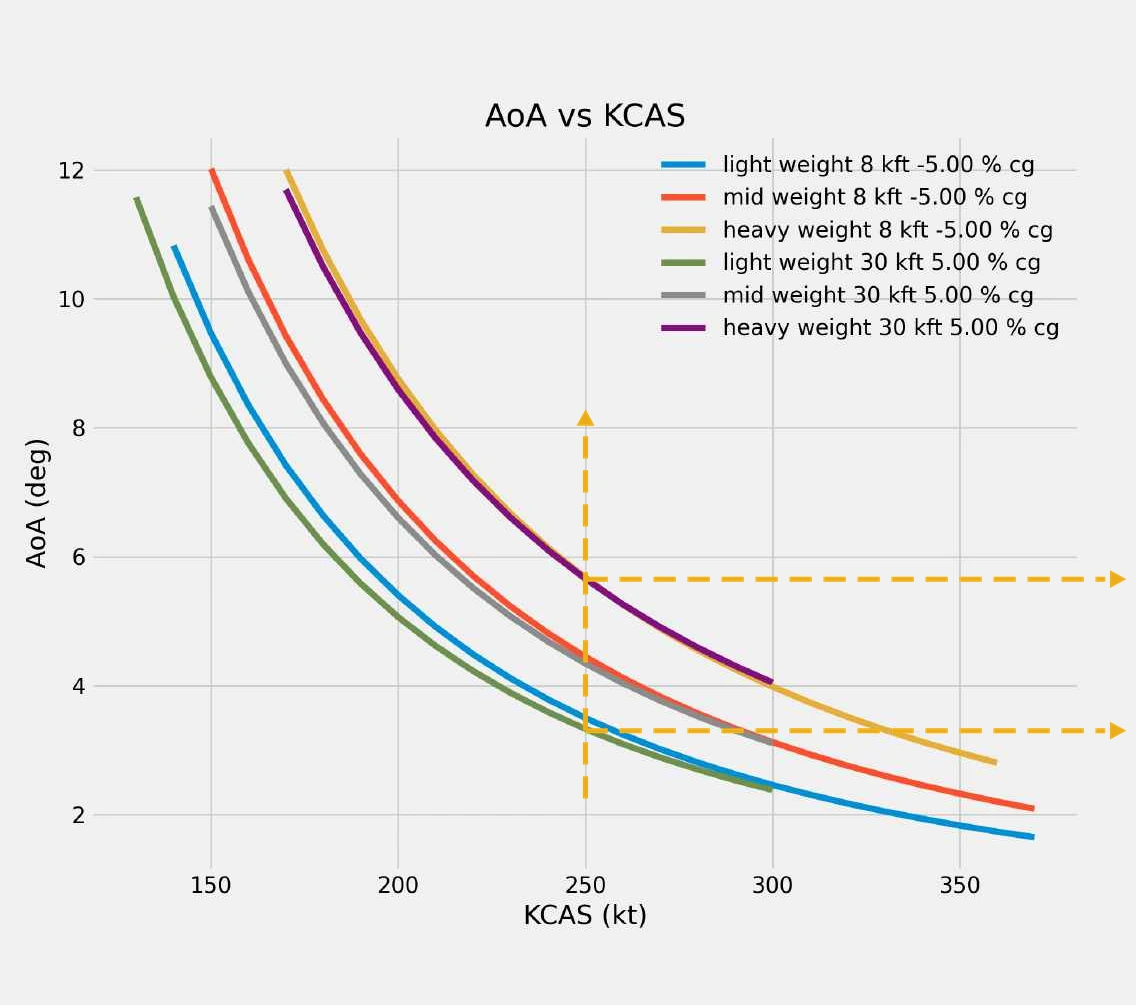
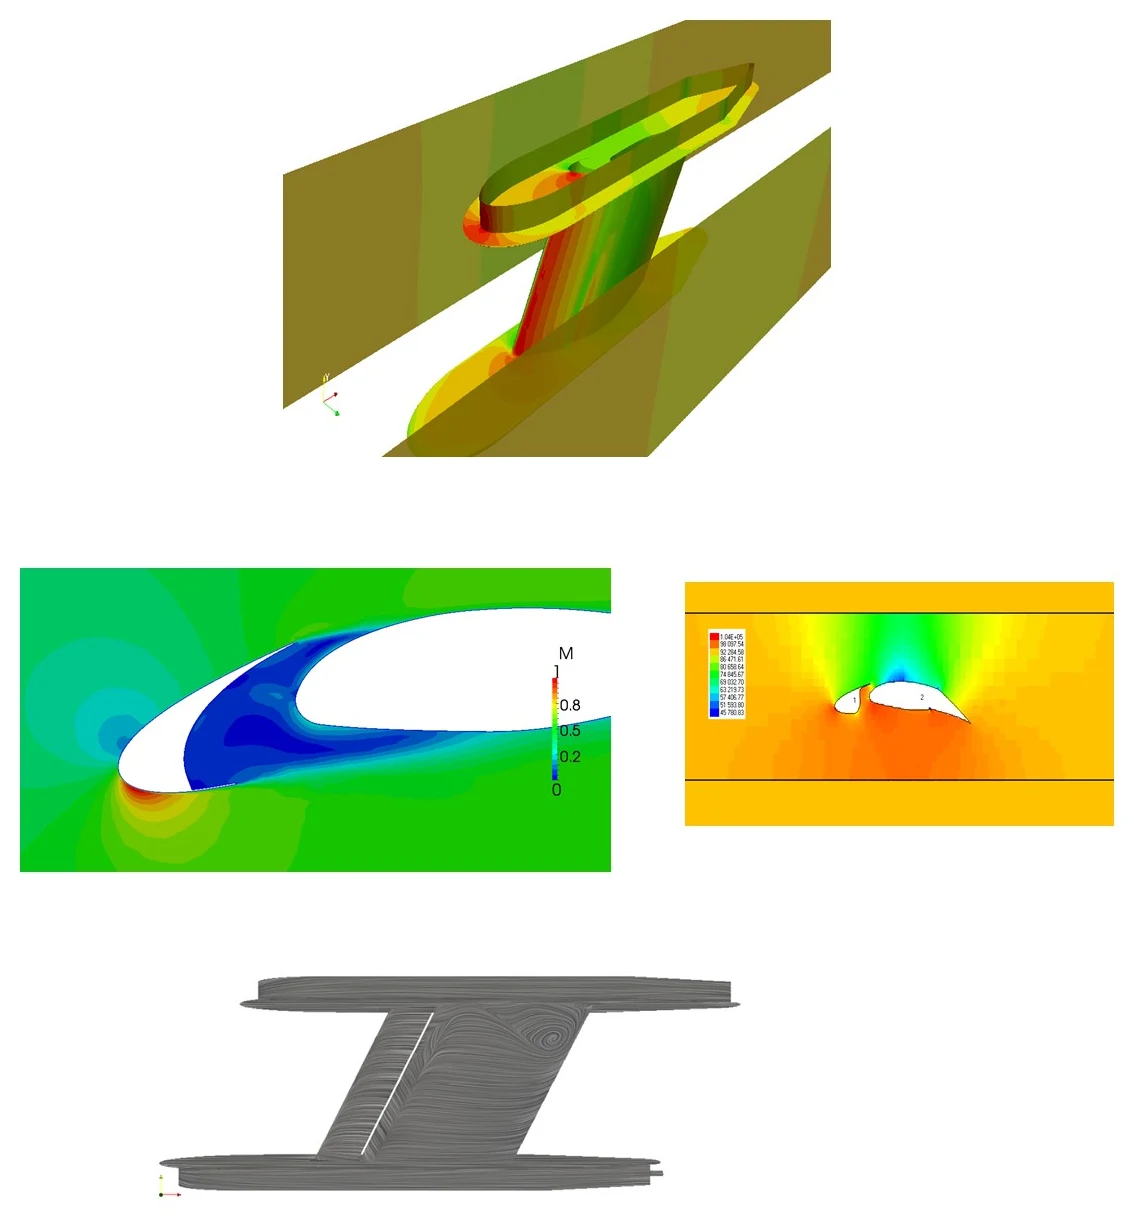
A JSBSim flight model gives the angle-of-attack range at each calibrated airspeed while weight and centre of gravity vary, so the droplet limits cover the real envelope.
Where the model comes from, and how it evolved
From the PhD at Poli-USP to iceAccretionFoam, with the papers behind each step.
The accretion model couples the flow, the droplet trajectories, the boundary layer and the mass and energy balance on the surface. It was born at Embraer and Poli-USP and is still being developed at ATS.
- 2003–2009Research
Poli-USP, supported by Embraer and FAPESP: anti-ice model with continuous film and rivulets (runback).
Validated against the Al-Khalil et al. (2001) test and NASA ANTICE. MSc (2003) and PhD: thesis at Poli-USP.
- 2007–2010Research
Laminar-turbulent transition and intermittency in heat transfer and ice shape.
Stefanini, Silvares, Silva and Zerbini (COBEM 2007; AIAA 2008-474). See Publications.
- 2008–2009Research
Cal State Long Beach: Cebeci compressible differential boundary layer integrated into the code.
Silva, Silvares, Zerbini, Hefazi, Chen and Kaups, AIAA, 2009.
- 2010–todayProject
Pitot probes: heat load and test envelope models, from spreadsheet to Python.
Presented at SAE AC-9C (Portland, 2010) and used in eVTOL programs and probe certification.
- 2011Research
Wall functions for heat transfer on rough surfaces.
Silva, Arima, Branco and Pimenta, SAE 2011-38-0023.
- ProjectsProject
Electrothermal anti-ice code to define the power distribution in probes.
LWC probe: CFD for Cp and impingement, optimum electric power distribution and icing tunnel validation.
- 2023iceAccretionFoam
Start of the collaboration with Prof. Hrvoje Jasak.
Starting point of iceAccretionFoam, our own 3D solver (NUMAP-FOAM Summer School 2023).
- 2024iceAccretionFoam
First iceAccretionFoam paper and glaze ice at SAE AC-9C.
Teixeira da Silva et al., ICAS 2024-1112, Florence; SAE AC-9C, Ottawa.
- 2025iceAccretionFoam
Two papers in Philosophical Transactions of the Royal Society A, with Prof. Jasak.
Impingement and rime ice and glaze ice; presentation at SAE AC-9C, CIRA, Capua.
- 2026iceAccretionFoam
FAPESP PIPE 2025/19697-9 and the ATS accretion model in the site applets.
Phase 1 (July 2026 to February 2027): 2D beta, rime and glaze; Phase 2: 3D MVP with thermal anti-ice and de-ice (FAPESP, post). The ATS accretion model in Python, checked against LEWINT and the NASA test, runs the icing applets on the site.
Four tools, chosen case by case
CFD++ and iceAccretionFoam handle 3D. FENSAP-ICE and LewInt give independent references.
| Tool | What it does for your project | Status |
|---|---|---|
| CFD++Metacomp | 3D compressible flow, droplet impingement and rime ice on full aircraft geometries, used in our client projects. ATS is the exclusive distributor in Brazil. | In production use |
| iceAccretionFoamATS, foam-extend 5.0 | One 3D solver for flow, droplets, water film and ice growth. Ice grows without re-meshing. Water follows the surface shear lines on swept wings. Cp, β and 2D rime are validated, 2D glaze is in validation, and 3D and SLD follow in 2027/28. | In validation |
| FENSAP-ICEAnsys | Our engineers run it on a licence you provide, as on the Akaer STC where the customer required it, and compare it with our other tools when a cross-check helps the report. | Client-supplied licence |
| LEWINT (LEWICE)NASA, American Kestrel | Fast ice shapes and thermal runs from NASA’s LEWICE, with the LewInt interface for batch runs and automated plots. LewInt is the international version of LEWICE 2D, and ATS holds a licence. We used it for the Vertical eVTOL ice shapes. | Licensed |
Using more than one code is deliberate. The codes differ in physics and in how well regulators know them, and agreement between them is evidence for your report. NASA Spinoff describes how LewInt extends LEWICE.
Evidence you can check
Project work first, then results shown at community workshops, then the validation of our own solver.
Project work
Client projects: Vertical (2025), Joby (2023–24), New Avionics (2017, drone ice detector), Collins Aerospace (2012), Droplet Measurement Technologies (LWC probe), Desaer (twin turboprop) and Zodiac Aerotechnic (ice detector). Client details and scope on request. Cases we can show follow.
| Project | What we did | Tools and tests | Result or venue |
|---|---|---|---|
| Akaer, ASOJ TA (STC)Project | STC of Turkish Aerospace (TA), with Akaer. ATS performed the substantiation and certification-support analyses, with simulation: ice accretion on the new antennas, radomes and additional devices of the STC, ingestion of the ice by the engines, and comparison with the baseline aircraft for the additional ice. | Substantiation, simulation and certification-support analysis by ATS. | 2020 to 2024. |
| Joby (eVTOL)Project | Air data probe CFD and droplet impingement, and icing certification. The OEM needed to certify the probe for cruise during escape from icing conditions. | 3D CFD. | Heat load mapping, 3D water catch, LWC concentration and speed near the probes, and Python programs that define operating and tunnel test points against SAE AS5562, which FAA TSO-C16b calls. 2023 to 2024. |
| Vertical (eVTOL)Project | Certification for inadvertent icing and a 3 to 5 minute escape, following EUROCAE ED-314. Focus on wing and stabilizer sections. | LEWINT (LEWICE 2D International). | Water catch, local impingement, 2D ice shapes and the full report ready for authority submission. 2025. |
| Collins Aerospace (former Goodrich), technology development projectProject | 3D droplet impingement study on an aircraft wing, compared with LEWICE 2D results, for a Collins Aerospace customer. | CFD++ and LEWICE 2D. | 2012. |
| LWC probe redesign, Droplet Measurement TechnologiesProject | CFD and ice protection system analysis to find the best design for the electrical heating of an LWC probe. | CFD for Cp and droplet impingement, electrical anti-ice code, icing tunnel tests to validate the code. | Optimum heating power distribution on the probe. |
| Desaer, twin turbopropProject | Icing analysis, design, testing and certification of a twin turboprop, non-pressurized aircraft for defense and commercial applications. | Simulation, design, testing and certification by ATS. | ATL-100 program. |
| Embraer: NASA Icing Research Tunnel test bodyProject | Position and loads of a test body in the icing tunnel. The NASA Glenn tunnel requires a structural report for safe operation. | 3D fully turbulent RANS and 2D Euler for the aerodynamic loads, FEA for the structural loads. | Body position defined and structural loads report issued. |
| Zodiac Aerotechnic: ice detector shapeProject | Shape optimization of an ice detector to weaken the shock wave and increase convective heat transfer. | CFD on several candidate shapes. | Best heat transfer coefficient selected, pressure and friction drag minimized, shock wave weakened. |
| Embraer: smart probes certificationIndustry | Certification of the E170/190 smart probes. The response to an EASA CRI anticipated, in 2003/2004, the liquid water conditions of SAE AS5562, which TSO-C16b only included more than a decade later. | Innovative approach with intensive use of simulation and CFD++. | E170/190 programs, 2003 to 2004. |
| Embraer: wing (slat and wing anti-ice)Industry | Design and certification of the thermal anti-ice of the slat and wing, and of the pitot, TAT and static port probes. | LEWICE simulation, tests in the NASA icing tunnel, wind tunnel and flight test campaigns. | E145, E170 and E190 programs, with certification reports. 1997 to 2007. |
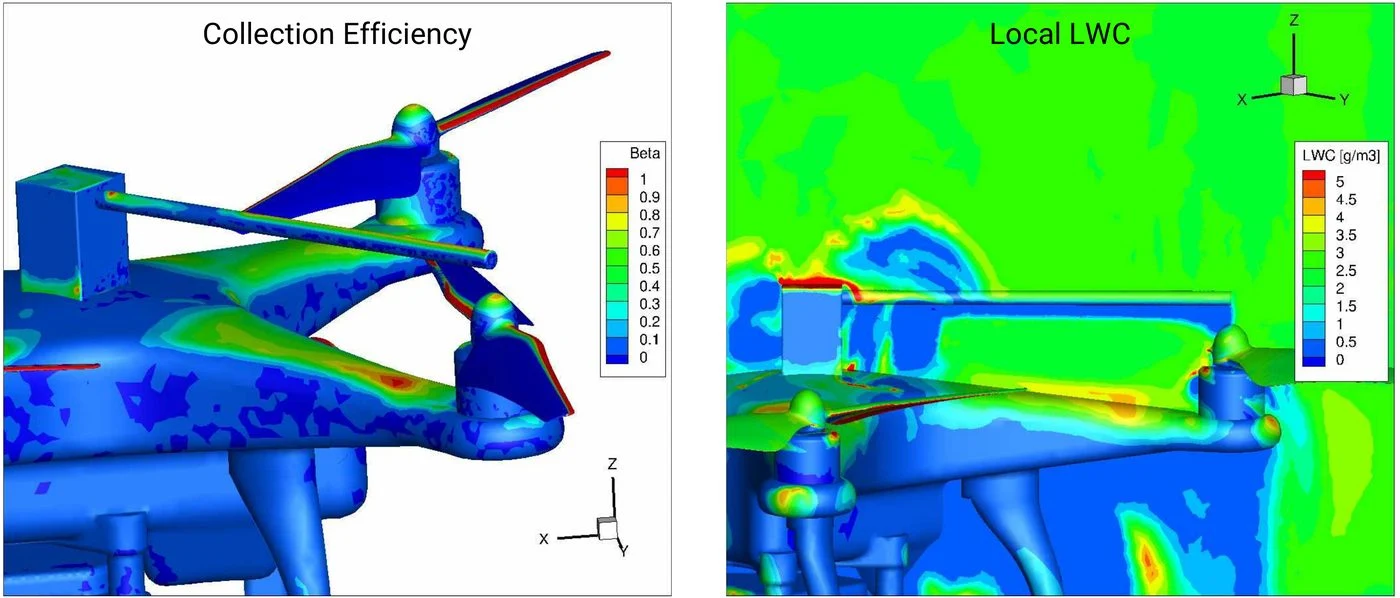
| New Avionics: ice detector on a droneProject | CFD to find the best place for an ice detector on a DJI Phantom III drone: flight performance model, angle of attack and cruise speed, icing conditions, and the effect of the propellers on collection efficiency and local liquid water content in take-off, landing, hover and cruise. | CFD++ and a flight performance model. | Presented at SAE AC-9C, Colorado Springs, 2018. 2017. |
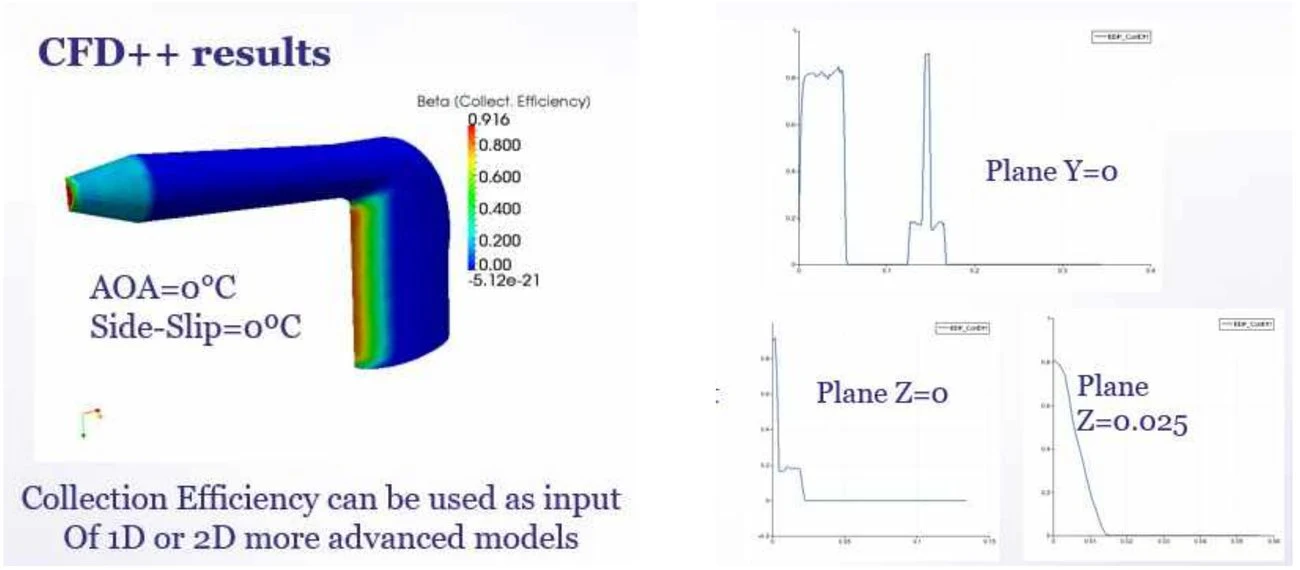
| Pitot tube, A-4 Skyhawk, Brazilian NavyProject | Water collection on the pitot tube at zero angle of attack and sideslip. | CFD++. | Peak β of 0.916. The distribution feeds 1D or 2D heater models. |
| Akaer, ASOJ TA: critical conditions and impingement limitsProject | Critical points from the airspeed and altitude envelope, and angle-of-attack ranges for light and heavy aircraft with forward and aft centre of gravity. | JSBSim flight model, Python, CFD++. | Part of the ASOJ TA package. Shown below. |
| Air data probes: heat load and envelope analysisProject | Python programs that define the operating points and the icing tunnel test points, compared with old and current standards: FAR 25 Appendix C, EASA, BS 2G 135 and SAE AS5562, which FAA TSO-C16b calls. | Python programs and a thermal model based on AIR1168/4 with evaporative cooling. | Used at Joby and presented at SAE AC-9C, Portland, 2010. |
| Icing tunnel and pitot tests at UFRJProject | Design and installation of the first icing tunnel in Brazil, pitot icing tests in flight and in the tunnel, two thesis committees, a journal paper and the investigation of the Air France 447 accident. | Icing tunnel, flight tests and thermal models. | J. Braz. Soc. Mech. Sci. Eng., 2016. |
Community workshop: 1st AIAA Ice Prediction Workshop
Three impingement cases run with CFD++, with good results on supercooled large droplets.
iceAccretionFoam validation ladder
This is our own solver, in development, and it is separate from the project work above. Each step is compared with published experimental data before the next one starts. Rime shapes on the NACA 0012 agree with NASA measurements. For glaze the code reproduces the behavior, and the upper horn is still smaller than measured while thermal freezing fraction and convective heat transfer with transition are added in 2026.
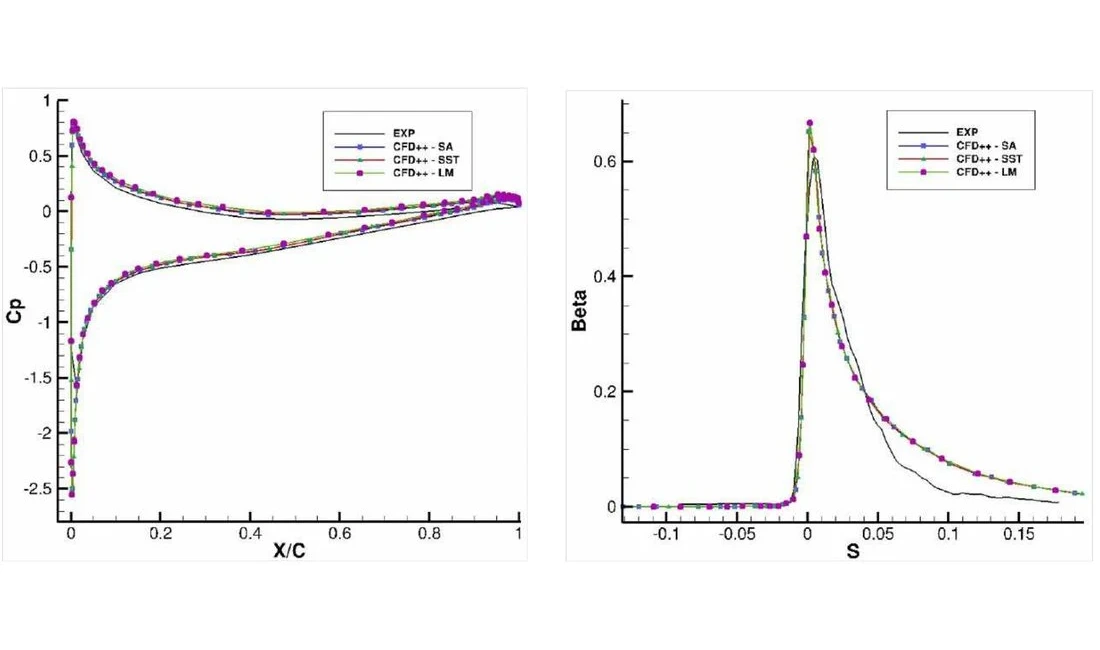
- Cp and βDone
- 2D rime iceDone
- 2D glaze iceIn progress
- 3D shapes and SLDNext
- Thermal ice protection systemsNext
Reference cases: NACA 0012 at 100 mph, Cp against Emmons (1948) and XFoil, β against Al-Khalil et al. (2001, NASA), rime and glaze shapes against Shin and Bond (NASA) and LEWICE.
iceAccretionFoam papers and presentations
- Teixeira da Silva et al. (2025). Introducing the iceAccretionFoam solver: impingement and rime ice accretion. Phil. Trans. R. Soc. A.
- Carvalho et al. (2025). Advancing the iceAccretionFoam solver: glaze ice accretion. Phil. Trans. R. Soc. A.
- Teixeira da Silva et al. (2024). Initial development of a CFD icing tool. ICAS 2024-1112, Florence.
- SAE AC-9C, Capua (2025). iceAccretionFoam: rime and glaze ice accretion.
- SAE AC-9C, Ottawa (2024). Advancing the iceAccretionFoam solver: glaze ice accretion.
- Lima da Silva et al. (2011). Proposed wall function models for heat transfer around a cylinder with rough surface in cross flow. SAE 2011-38-0023.
Examples
Select an image to see each example.

1 / 12
Drone
New Avionics drone project: collection efficiency β (left) and local liquid water content (right) on a quadrotor with rotating propellers during vertical take-off. CFD++, presented at SAE AC-9C, Colorado Springs, 2018.
Request a technical proposalWhere the experience comes from
Ten years of anti-ice design and certification at Embraer, then client projects at ATS, together with research and the development of our own solver.
Industry Embraer, 1997 to 2007Project ATS client and facility projectsResearch Papers, workshops and committeesiceAccretionFoam Development of our own 3D solver
- 1997–2007Industry
Embraer: design and certification of anti-ice for the wing and for pitot, TAT, static port and smart probes, with tests in the NASA icing tunnel and simulation.
E190: pneumatic system, ECS and the icing certification, with its wind tunnel and flight test campaign and reports. E145: probe technical support, ADs, service bulletins and flight manual. E170/190: smart probes certification, an innovative, simulation-intensive job with CFD++, answering an EASA CRI that anticipated in 2003/2004 the liquid water conditions of SAE AS5562, which TSO-C16b only included more than a decade later. Slat and wing thermal anti-ice with LEWICE simulation and tests in the NASA icing tunnel. Also the 2001 probe certification process with manufacturers and authorities, and an engine anti-ice system (SAE, 2007).
- 2003–08Research
Airfoil anti-ice modeling in the M.Sc. and Ph.D. at the University of São Paulo, in parallel with the Embraer work.
- 2007Research
Two Journal of Aircraft papers on airfoil thermal anti-ice simulation, still among the most cited.
- 2007Project
ATS begins engineering, testing and certification services supported by simulation.
Icing projects for industry on probes, wings and eVTOL follow, including collection efficiency on the pitot tube of a Brazilian Navy A-4 Skyhawk.
- 2009Research
At Cal State Long Beach, integrated Cebeci’s compressible differential boundary-layer method into his anti-ice code, with the runback water flow.
AIAA paper with Profs. Hefazi, Chen and Kaups.
- 2010Research
Air data probe heating model presented at SAE AC-9C, Portland.
- 2011Research
Rough-wall heat transfer wall functions, validated on a heated rough cylinder and implemented in OpenFOAM and CFD++.
- 2016Project
Pitot icing in flight and in the icing tunnel designed for UFRJ, the first in Brazil.
Results in the Journal of the Brazilian Society of Mechanical Sciences and Engineering.
- 2012Project
Collins Aerospace (former Goodrich): 3D droplet impingement study with CFD++ on an aircraft wing, compared with LEWICE 2D, in a technology development project for a Collins Aerospace customer.
- 2017Project
New Avionics: ice detector placement on a DJI Phantom III drone with CFD++, including the propeller effect on collection efficiency and local liquid water content.
Presented at SAE AC-9C, Colorado Springs, 2018.
- 2020–24Project
Akaer, ASOJ TA: Turkish Aerospace STC, ice-accretion substantiation and certification-support analyses.
ATS performed the analyses, with simulation, for ice on the new antennas, radomes and devices, engine ice ingestion, and the additional ice against the baseline aircraft.
- 2022Research
1st AIAA Ice Prediction Workshop with CFD++.
Handbook of numerical simulation of in-flight icing. Lecture at SUNY Korea.
- 2023–24Project
Joby (eVTOL): air data probe CFD and droplet impingement, and icing certification.
Heat load mapping, 3D water catch, LWC concentration near the probes and tunnel test planning.
- 2023iceAccretionFoam
NUMAP-FOAM Summer School at the Cavendish Laboratory, Cambridge, and work with Prof. Hrvoje Jasak on iceAccretionFoam.
- 2024–25iceAccretionFoam
iceAccretionFoam: ICAS 2024, two Phil.
Trans. R. Soc. A papers, SAE AC-9C in Ottawa and Capua.
- 2025Project
Vertical (eVTOL): 2D ice shapes for wings and stabilizers with LEWINT, for inadvertent icing and a 3 to 5 minute escape under EUROCAE ED-314, with the full report ready for authority submission.
- 2026iceAccretionFoam
iceAccretionFoam: FAPESP PIPE approved.
Phase 1 delivers the 2D beta in December. Phase 2 targets the 3D MVP.
Programs we support
Sensor and probe suppliers
Pitot, TAT, angle-of-attack vanes and smart probes, where rules such as TSO-C16b call SAE AS5562.
Modifications and STCs
New probes, antennas, radomes or propulsion installed on aircraft that are already certified. We compare each change with the baseline aircraft and check ice ingestion by the engines.
Drones, eVTOL and electric aircraft
Rotors and small airframes with no representative 2D section, often without a conventional ice protection system.
Suppliers that offer a bigger package
Akaer and Droplet Measurement Technologies use ATS to complement their expertise and deliver a complete package to their final customer, under that customer’s statement of work.
Peak workload support
Engineering groups that already have icing expertise, such as Embraer, use ATS to absorb peaks of work.
Programs under FAA, EASA and ANAC
Wings, tails, inlets, propellers and windshields for FAR/CS 23 and 25 programs that need icing evidence. ATS meets FAA specialists regularly, with dedicated meetings to present issues and solutions using CFD and ice shape simulations, and is in frequent contact with ANAC, CAA and Transport Canada.
How an engagement runs
The same steps apply to a probe, a wing or an eVTOL rotor. Ice protection system design follows as its own service.
Mission and performance
Mission profile, weights, speeds and altitudes. Angle-of-attack ranges from flight dynamics.
Icing matrix and impingement
Critical points in the Appendix C and O envelopes. 3D flow, droplet paths and impingement limits.
Baseline ice shapes
Rime and glaze ice shapes on the unprotected surface, at the critical points and for the escape conditions.
Safety assessment: aerodynamic effects
Aerodynamic degradation, lift margins, and the drag and weight increase caused by ice, rating ice criticality from minor to catastrophic (FHA). This assessment decides whether the aircraft needs an ice protection system, and is written up as a certification report.
Safety assessment: engine ice ingestion
Hazard analysis for ice shed from protected and unprotected surfaces into the engines, written up as a certification report.
Certification report and test plan
Numerical model description, validation and ice shape results, written in certification format and ready for submission to the authorities, plus a reduced set of tunnel and flight test points verified with artificial ice shapes mounted on the wings and other surfaces. All under NDA.
No certification is reached without numerical tools.
Dr. Guilherme A. Lima da Silva, The Icing Engineering Process
Recognition, talks and press
- American Kestrel Company lists ATS among the organizations that performed 3D icing analysis for its programs
- FAPESP approves iceAccretionFoam under PIPE (2026)
- ATS presents iceAccretionFoam at SAE AC-9C in Italy (2025)
- Aircraft icing explained: interview with Revista Asas (2024)
- Handbook of Numerical Simulation of In-Flight Icing (2022)
- Aço Verde do Brasil Award 2026, with Samarco: a low NOx burner designed with CFD cut NOx by up to 37%