 Skip to content


Services / Erosion
Erosion engineering for oil and gas equipment: CFD, structural analysis and validation
Erosion rate of pipeline junctions, ducts and valves with sand and particles, from 3D CFD++ and a methodology validated with experimental data. The same model feeds the stress analysis, so you know the service life.
A methodology approved by operators, drilling contractors and an oil company research center, validated with experimental data and compared with the literature.
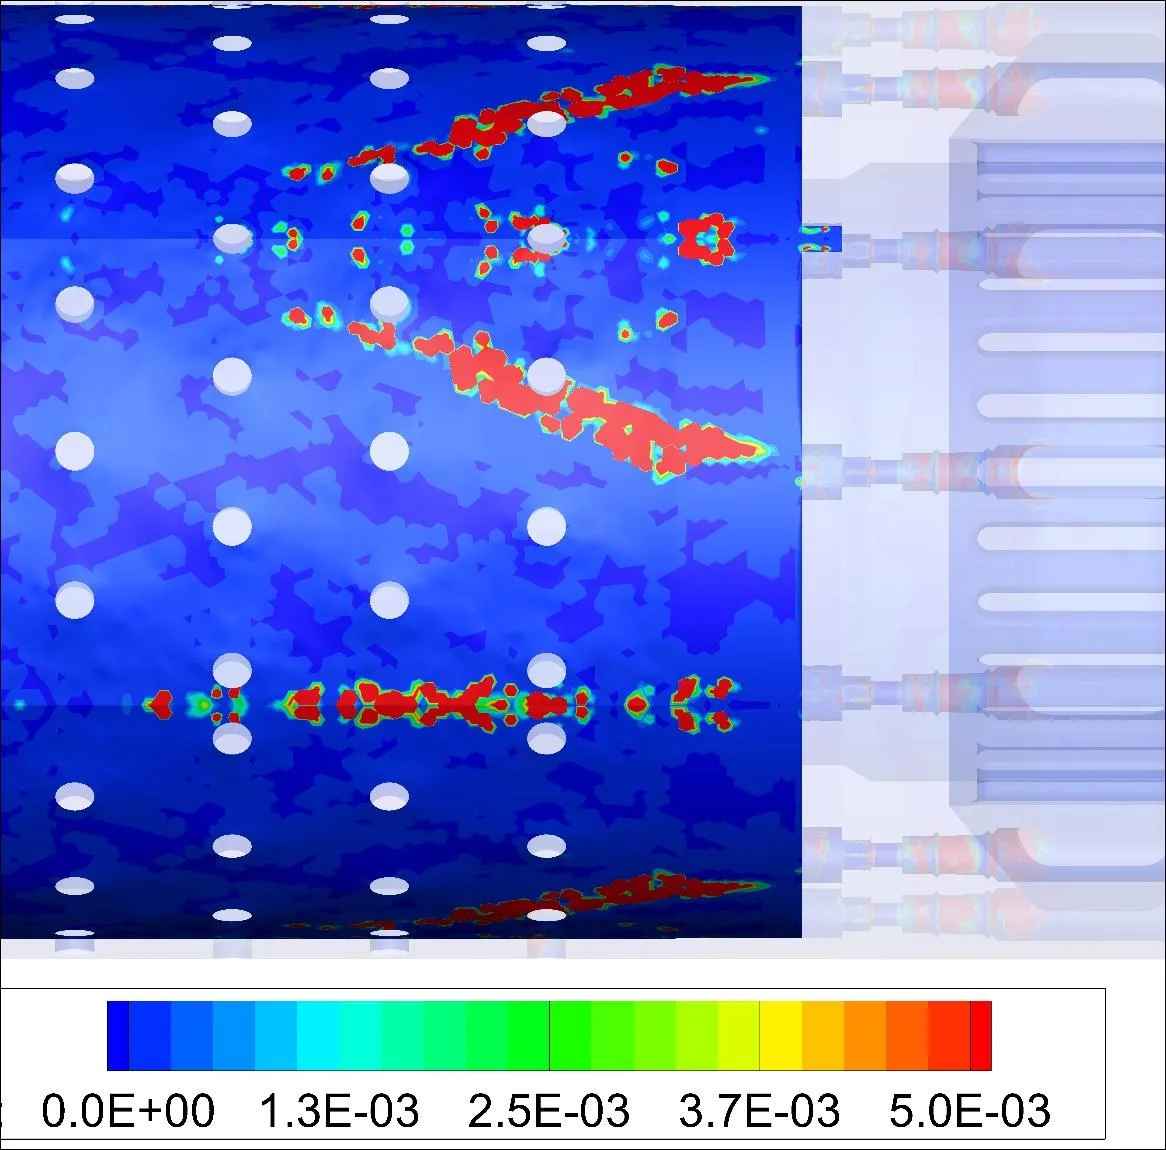
Erosion analysis track record
- Approved methodologyApproved by operators, drilling contractors and an oil company research center.
- Experimental validationErosion simulation results with good adherence to experimental data, for ducts and for a sliding sleeve valve.
- Improved on a prior methodAn improvement over the methodology previously adopted by Petrobras and Constellation.
- Service life, not only a rateErosion followed over 5, 10 and 20 years, with the stress analysis according to ASME VIII and API 6A.
- Global supplierApproved as a supplier of a global oilfield services company, after test cases of nonlinear FEA, contact and erosion CFD.
Complete solutions, from erosion rate to a design with longer life
We prefer whole projects to isolated simulations: ATS responsible for the erosion analysis, the structural check and the redesign.
Erosion plus structure
The erosion rate is only half the answer. With fluid-structure interaction we check whether pipelines and joints still withstand the pressure after years of erosion.
Redesign of the component
When the rate is too high, ATS studies geometry and material, and designs a component with longer service life.
Method you can audit
Based on specialized literature and validated with tests, so your team and your client can follow each step.
Need only a part? We define the scope with you.
What you receive
Erosion rate map
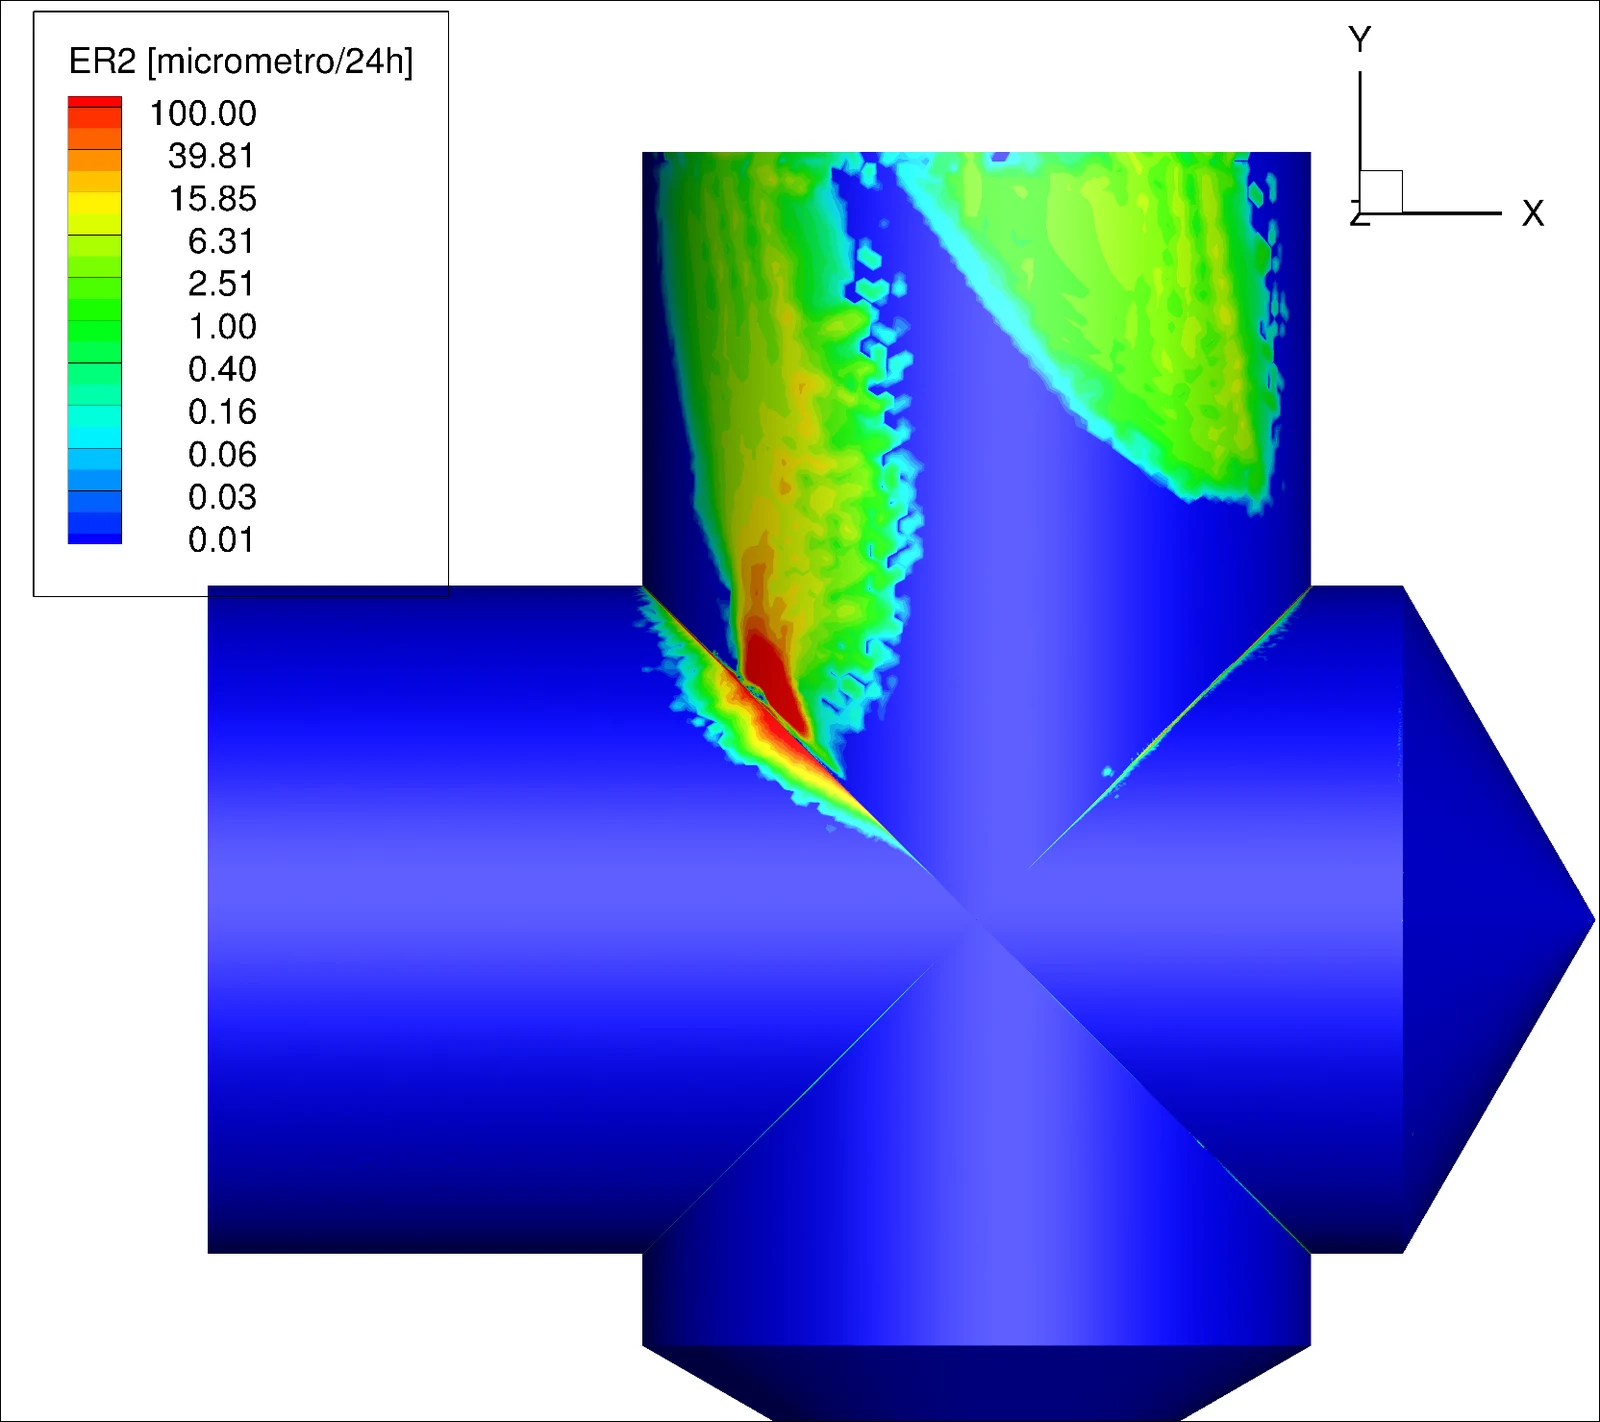
Annual erosion rate over the whole geometry, with all materials and the complex geometry of the duct.
Erosion models and operating modes
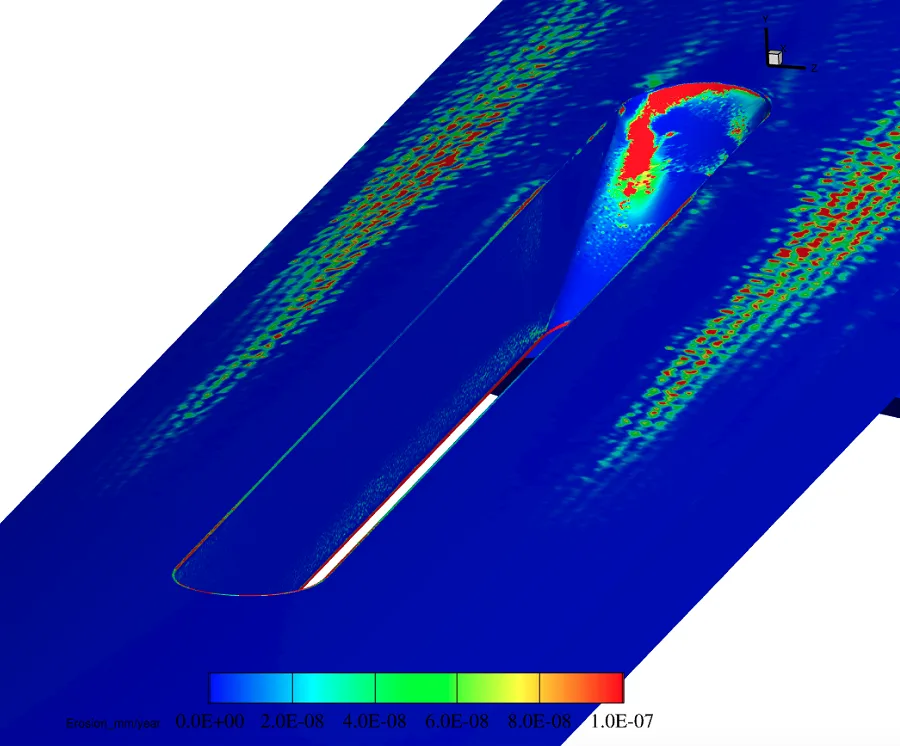
Comparison between erosion models, and the influence of the operating conditions on the distribution of erosion.
Erosion along the service life
Variation of the erosion rate along the life of the component, at 5, 10 and 20 years.
Fluid-structure analysis
Stress analysis of the eroded part with CFD++ and Femap with NX Nastran, per ASME VIII (Boiler and Pressure Vessel Code) and ANSI/API 6A.
Redesign
A new geometry or material for longer service life, with non-Newtonian fluid and particles in the CFD.
Validation
Comparison with experimental data, scientific papers and tests made by the client.
How ATS calculates erosion
The problem
Oil pipelines carry oil, gas and water, and with them suspended particles that hit the walls, especially at junctions called cross-blocks. With high pressure and flow, the walls erode. This limits the life of the component and requires inspections to keep operation safe.
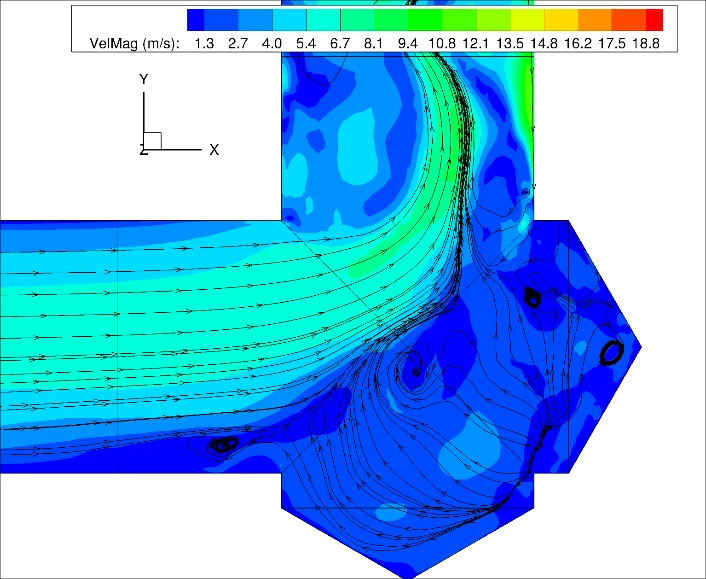
If the fluid were only water, the particle impact regions would be easier to predict. Oil is a non-Newtonian fluid, so a tool like CFD++ is needed to analyze erosion and critical wall thinning in three dimensions.
Methodology
ATS developed an erosion rate calculation methodology based on specialized literature, validated with experimental data. The impact angle and velocity calculated with CFD++ are used, and the erosion rate is post-processed in Tecplot 360 with automation macros.
The methodology was approved by operators, drilling contractors and an oil company research center.
Fluid-structure interaction
Through fluid-structure interaction (FSI) we can see whether pipelines and joints withstand high pressure after years of erosion. ATS runs it with CFD++ and Femap with NX Nastran, which are reliable when coupled and give results close to the real phenomena.
The FSI analysis showed that conventional analyses based on average velocity can be ultra-conservative and often do not show how to improve the geometry or the material.
Mesh and turbulence
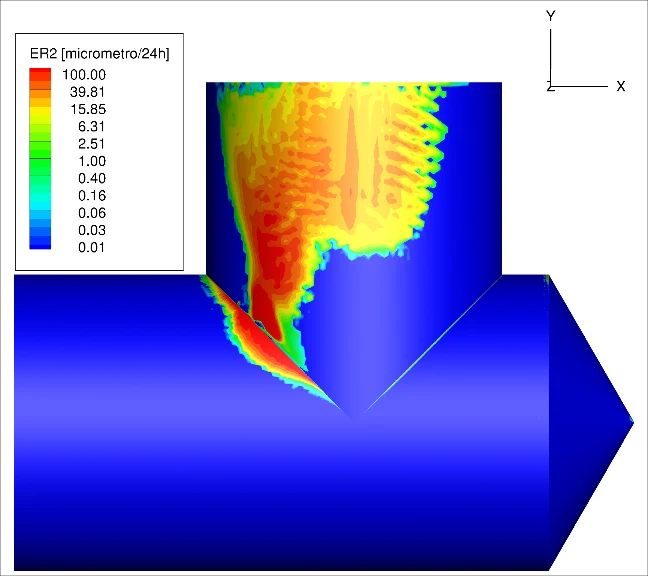
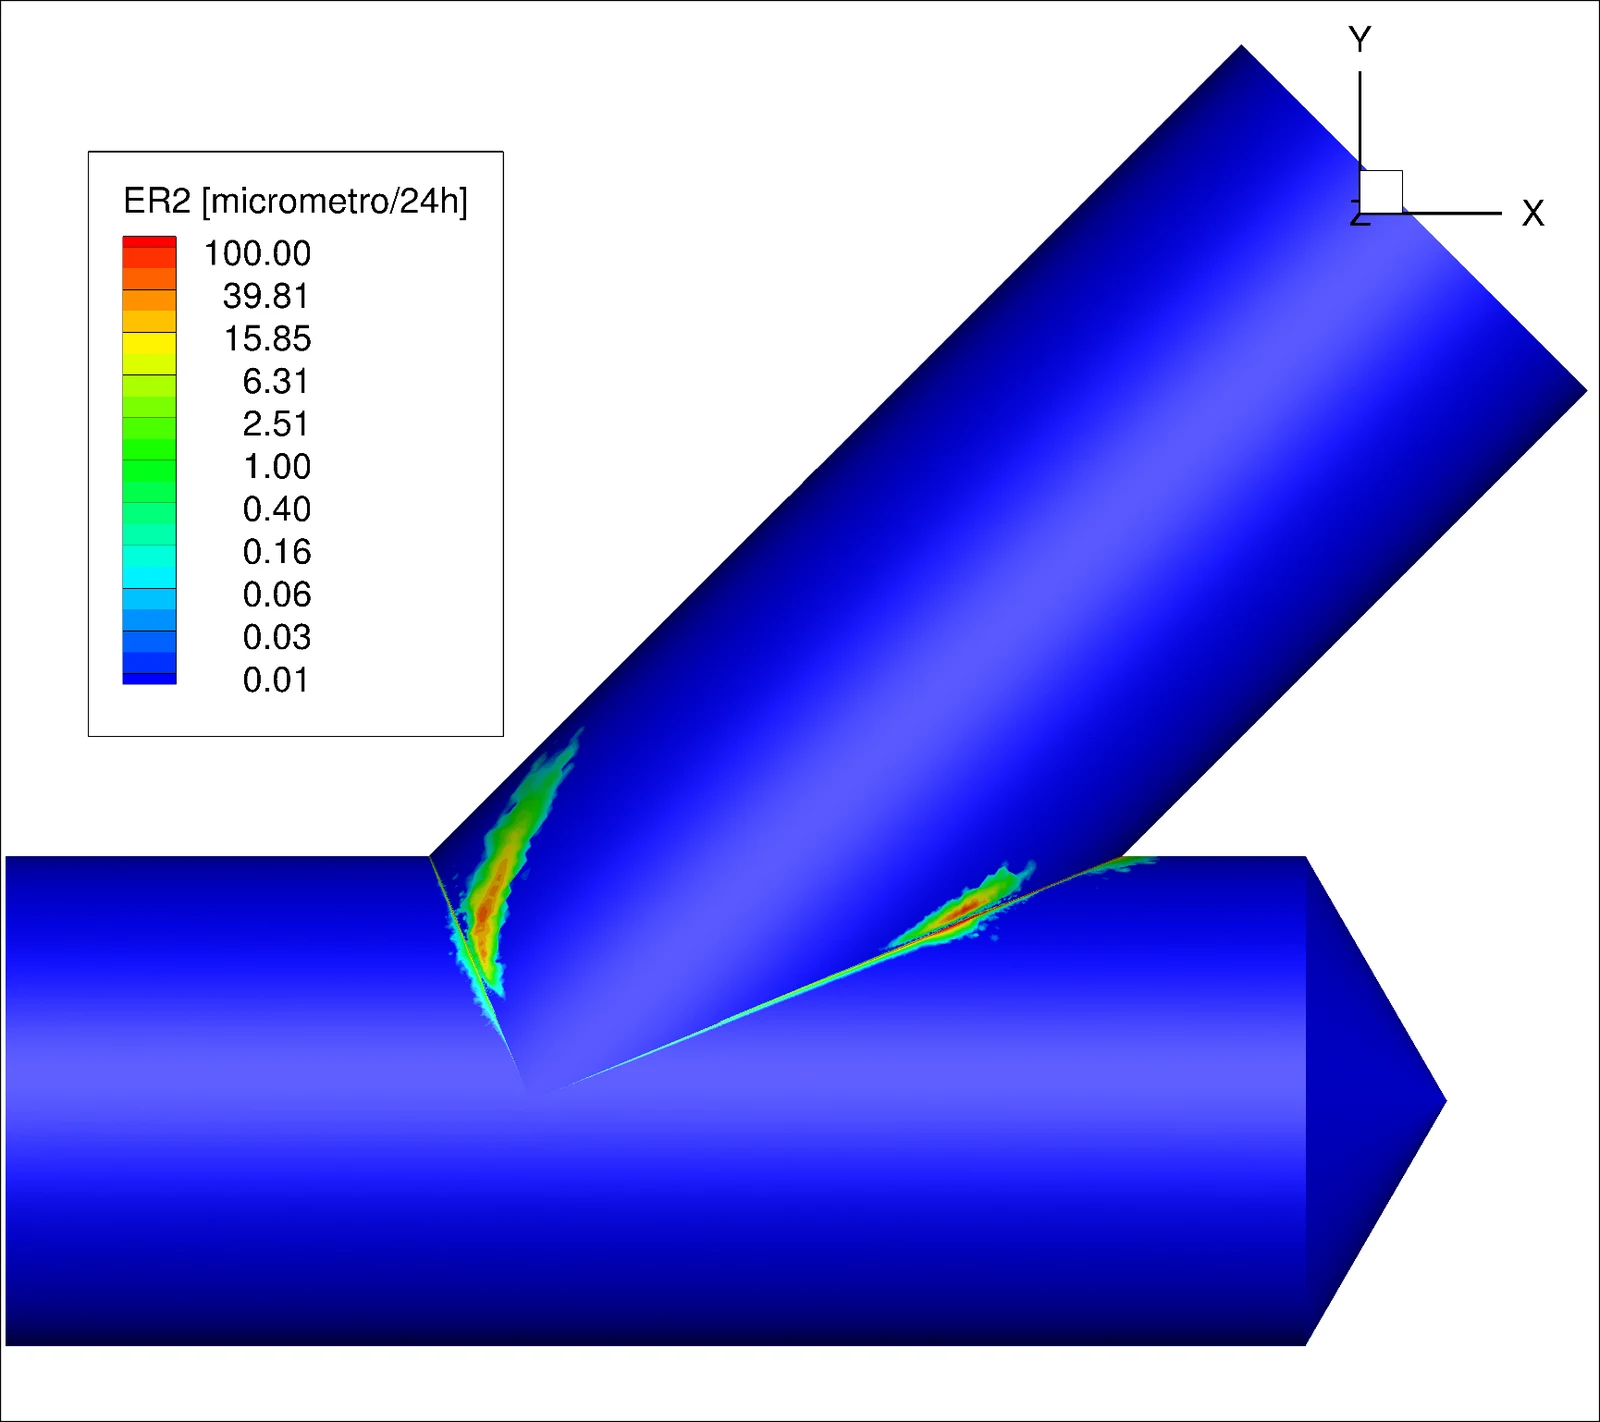
In a study of three cross-block and tee geometries, the mesh went from 4.8 to 11.3 million elements, with a prism layer of 0.01 mm to solve the flow up to the wall. The spurious errors at the corners decreased, the maxima in the pipes increased, and the highest erosion occurred at the corners.
Tools, and where each one fits
Tools serve the engineering work. We say what each one does in the project.
| Tool | Role in the project | Status |
|---|---|---|
| CFD++ | Fluid flow, heat transfer, combustion and particles in 3D. ATS is the exclusive CFD++ representative in Brazil. | Licensed |
| Tecplot 360 EX | Post-processing and automation macros, including erosion rate calculation. | Licensed |
| Femap, NX Nastran, Adina | Stress analysis, contact, hyperelastic and nonlinear materials, thermal and fluid-structure coupling. | Licensed |
Evidence you can check
Work for operators and oilfield services companies.
Project work
| Project | What we did | Tools and tests | Result or venue |
|---|---|---|---|
| Halliburton: duct under high shear stressProject | Erosion of a duct under high shear stress. | 3D CFD++. All materials and the complex duct geometry. | Annual erosion rate predicted. Good adherence with experimental data. Improvement over the methodology adopted before by Petrobras and Constellation. |
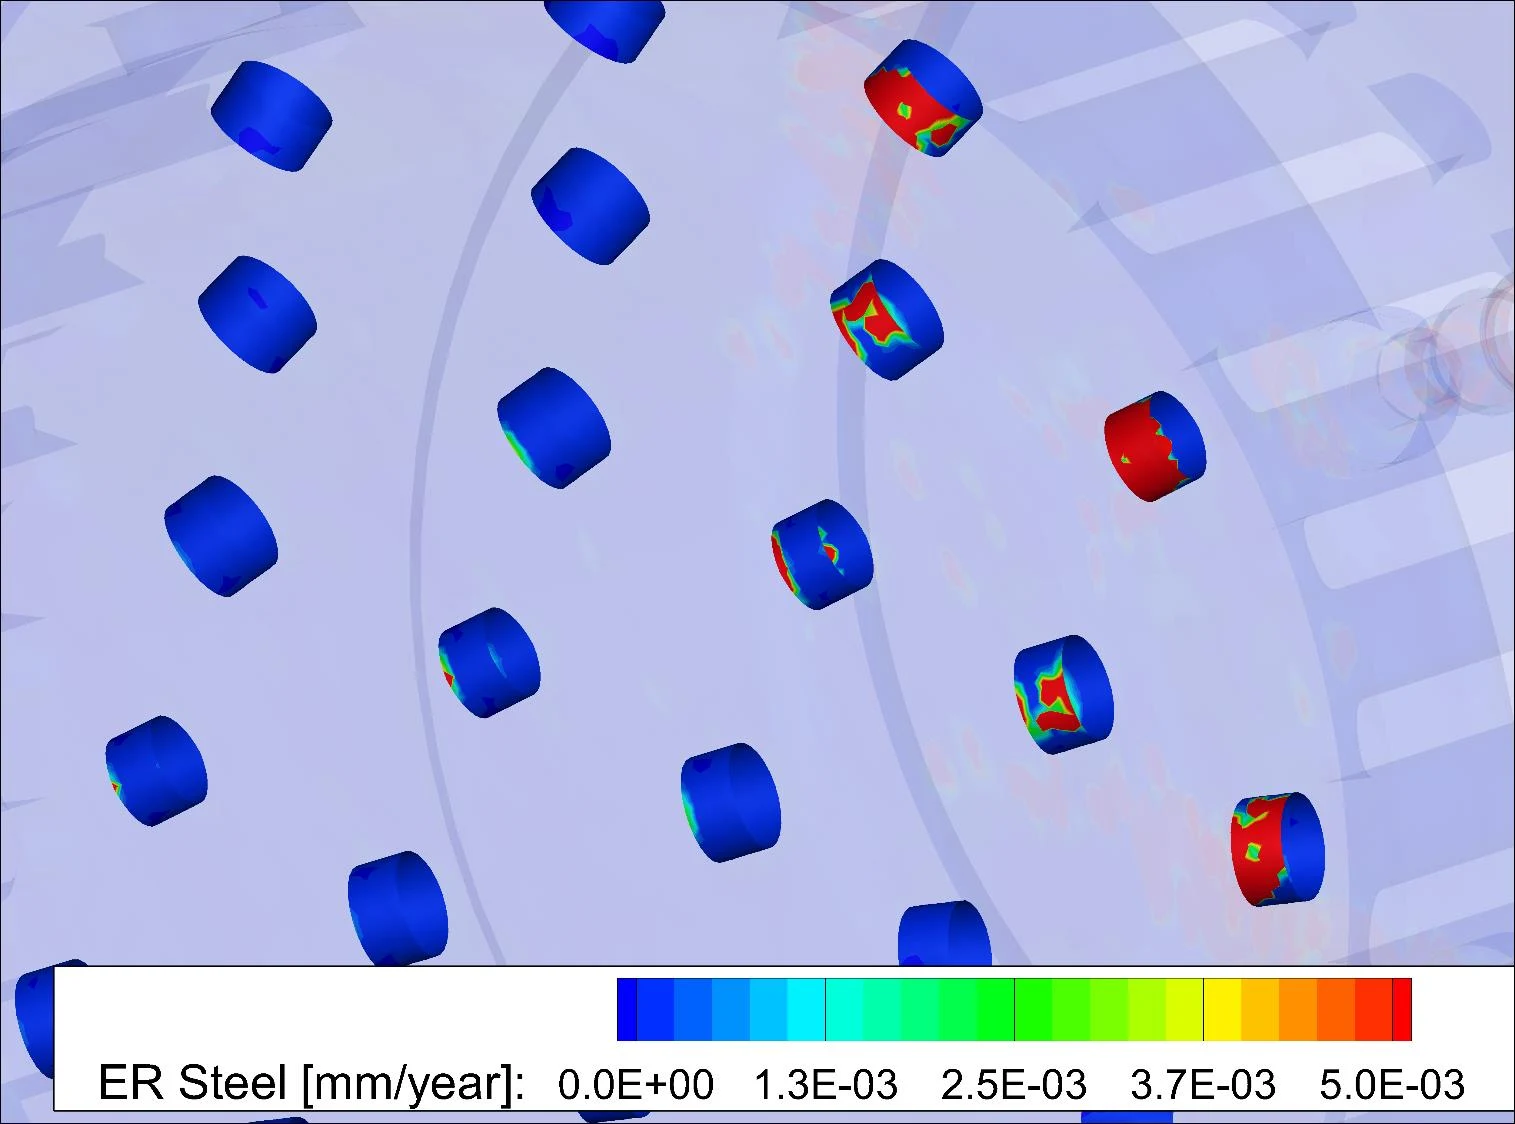
| WellTec: sliding sleeve valveProject | Erosion of a sliding sleeve valve with sand particles in the flow. | CFD with the erosion models and operating modes set by the client. | Annual erosion rate over the whole geometry. Comparison between erosion models and influence of operating conditions. Experimental validation. |
| Constellation: junctions of oil pipelinesProject | Erosion of oil production ducts at junctions (cross-blocks). | CFD of a non-Newtonian fluid mixed with particles. Stress analysis in NX Nastran per the ASME pressure vessel code. | New duct designed for longer service life. |
| Queiroz Galvão: cross-blocks and teeProject | Erosion study of three geometries: cross-block 45°, cross-block 90° and tee 90°. Non-Newtonian fluid with particles. | CFD++ with a wall function first, then solved to the wall with a 0.01 mm prism layer and 11.3 million elements. | Highest erosion at the corners. In the 90° cases, the turbulence from the change of direction raises erosion on the upper part of the duct. |
| Halliburton: supplier approvalProject | Test cases of nonlinear FEA, contact and erosion CFD in system components. | Nonlinear FEA and contact, and erosion CFD. | Approved as a global supplier, in the United States and Brazil, with a long-term contract for subsea system analysis. |
Examples
Select an image to see each example.
How an engagement runs
Diagnosis and goal
We define the problem, the operating conditions and the target with your team.
Model
The geometry of the equipment is prepared and the physics that apply are chosen.
Analysis
Numerical calculation based on the applicable physical principles.
Checks and validation
Results are checked for consistency and compared with tests, plant data or the literature.
Solution and report
Design of the solution, specification of the test when needed, and the report.
Follow-up
Support in the field test or in operation, and revisions.
Related services
Questions engineers ask before they hire us
How do you validate the erosion rate?
With experimental data, scientific papers and tests made by the client. In one project the simulation reached good adherence with test data.
Why not use the average velocity?
Conventional analyses with average velocity can be ultra-conservative and often do not show how to improve the geometry or the material. ATS follows the erosion rate along the life of the component.
Do you check the structure after erosion?
Yes, with fluid-structure interaction in CFD++ and Femap with NX Nastran, following ASME VIII and ANSI/API 6A.
Do you handle non-Newtonian fluids?
Yes. Oil and drilling fluids are non-Newtonian, and the CFD++ models them with particles.
Is our data kept confidential?
Yes. We work under NDA, and your design data and reports stay with you.
Tell us about the component and the fluid
Send the geometry, the fluid, the particles and the flow conditions.
Email
sales@aerothermalsolutions.coPhone
+55 11 3854-4224OfficeAv. Pompéia, 634, cj. 107, São Paulo, SP, Brazil.
An ATS engineer replies. We work under NDA.